Mold Flow Analysis: A Complete Guide for Injection Molding Success
Injection molding relies heavily on predicting real-world performance before cutting steel. Mold flow analysis has become a standard engineering practice that helps manufacturers avoid costly mistakes, shorten lead times, and improve part quality across automotive, electronics, medical, and consumer goods industries.
This guide breaks down what mold flow analysis is, how it works, how to read a professional report, and why it works hand-in-hand with DFM (Design for Manufacturing) to deliver reliable, production-ready molds.
What Is Mold Flow Analysis?
Mold flow analysis is a CAE-based simulation technique that digitally models how molten plastic flows, fills, packs, cools, and shrinks inside an injection mold. Using specialized software such as Moldflow, C-Mold, and others, engineers run finite element analysis to forecast potential defects and optimize designs upfront.
By simulating the entire molding cycle, teams can detect and fix issues like short shots, weld lines, air traps, sink marks, warpage, and overpacking before mold manufacturing begins. This reduces tooling changes, lowers production risks, and creates a strong foundation for stable mass production.
Mold Flow Analysis and DFM: Better Together
DFM (Design for Manufacturing) focuses on making parts easier and more cost-effective to produce. It covers wall thickness, draft angles, rib design, undercuts, and assembly feasibility from the earliest design stages.
Mold flow analysis strengthens DFM by adding data-driven validation:
- It verifies whether a part design can fill evenly and consistently.
- It pinpoints where weld lines, air traps, or high shear may occur.
- It optimizes gate location, cooling layout, and process parameters.
- It supports decisions on material selection and mold structure.
Together, DFM and mold flow analysis reduce development cycles, improve part consistency, and lower overall manufacturing costs.
The Standard Workflow of Mold Flow Analysis
A professional mold flow study follows a clear, repeatable process to ensure accuracy and usability.
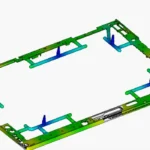
1. Mesh Generation
The 3D part model is imported from CAD formats including STEP, IGES, XT, PRT, and more. The software generates a finite element mesh that represents the part geometry.
Key goals:
- Achieve high-quality mesh for accurate results.
- Refine mesh in critical areas such as thin walls, ribs, and complex features.
- Balance simulation precision and computing efficiency.
2. Material Selection
Modern mold flow software includes extensive material databases covering thermoplastics, thermosets, and additives. Engineers select the exact resin grade to use in production and apply its rheological, thermal, and mechanical properties.
Common material models include:
- Viscosity models
- PVT behavior
- Crystallization kinetics
- Thermal conductivity and specific heat
Accurate material data directly impacts the reliability of fill, cooling, and shrinkage predictions.
3. Process Parameter Setup
Simulation parameters are set to match real production conditions. Most tools support two modes:
- CAE Mode: For quick design validation without machine limits.
- Injection Molding Machine Mode: For realistic process matching and trial-run support.
Key settings include:
- Fill time and multi-stage flow rate
- V/P (velocity / pressure) switch point
- Packing pressure and holding time
- Mold and melt temperature
- Cooling circuit and coolant flow
4. Analysis and Report Generation
Once the simulation runs, the software outputs detailed results including contour plots, graphs, and numerical data. These are compiled into a formal report for design review, customer communication, and mold development.
A complete report includes project info, material data, mesh quality, gate design, filling behavior, pressure distribution, clamp force, cooling efficiency, shrinkage, deflection, and improvement suggestions.
How to Read a Mold Flow Analysis Report
A well-structured report turns complex data into clear engineering insights. Below are the most critical sections.
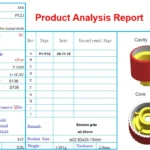
Basic Project Information
This section includes:
- Project and part number
- Material grade and properties
- Mold cavity layout
- Software version and analyst details
- Key parameters: melt temp, mold temp, fill time, max injection pressure, clamp tonnage
These details ensure transparency and reproducibility.
Material Data
Material specifications such as density, melt index, molding temperature, and shrinkage rate establish the baseline for all simulation results.
Mesh Quality Check
Mesh thickness diagnostics ensure the model is properly refined. Poor mesh can cause misleading results or simulation failure. Engineers review element size, aspect ratio, and distortion to guarantee valid outcomes.
Gate Location and Size Evaluation
Gates control how melt enters the cavity. The analysis evaluates:
- Balanced filling
- Pressure drop and velocity distribution
- Cooling efficiency
- Impact on weld lines and appearance
Optimal gate design reduces defects, improves consistency, and supports longer mold life.
Fill Time and Flow Front Pattern
Fill time results show how melt advances across the cavity. A good design achieves balanced filling — all sections fill at nearly the same time.
This view helps identify:
- Short shots (unfilled areas)
- Hesitation (slow flow in thin sections)
- Overpacking (excess material in local zones)
Nozzle Pressure & Injection Pressure Profile
Pressure curves show the force required to fill the mold. Abnormal spikes or uneven distribution signal gate issues, flow restrictions, or part geometry problems. Proper pressure management prevents flash, short shots, and material degradation.
Clamping Force Plot
The clamp force graph displays how much force is needed to keep the mold closed during injection. It must stay under the machine’s maximum capacity to avoid safety risks and part defects.
Air Traps
Air traps form when melt converges and traps gas. The simulation marks their exact locations so engineers can add vents, modify wall thickness, adjust gates, or tweak injection speed to eliminate them.
Weld Lines
Weld lines occur where two flow fronts meet. They can reduce strength and mar appearance. The report shows their position and intensity, allowing teams to optimize gates, adjust flow paths, or modify part design to minimize their impact.
Shrinkage and Volumetric Shrinkage
Shrinkage happens as molten plastic cools and solidifies. Non-uniform shrinkage causes warpage and dimensional errors. The analysis estimates shrinkage distribution so designers can apply proper shrink compensation and adjust packing parameters.
Deflection / Warpage Analysis
Deflection results show how the part may deform in X, Y, and Z directions due to cooling, shrinkage, and molecular orientation. Engineers use this data to adjust part design, cooling layout, or process settings to meet tolerance requirements.
Final Assessment & Recommendations
A complete analysis closes with a professional summary covering:
- Filling balance and stability
- Cooling efficiency
- Weld lines and air traps
- Shrinkage and deflection risks
- Gate and process optimization
- Clamp force and machine suitability
This section turns simulation data into actionable engineering steps for mold design and production.
Why Mold Flow Analysis Matters for Global Manufacturers
For overseas buyers and international mold buyers, verified mold flow analysis has become a key requirement when selecting suppliers. It proves engineering capability, reduces risk, shortens sampling cycles, and supports faster mass production.
Whether you are in automotive, medical devices, home appliances, or electronics, a professional mold flow analysis protects your investment, improves part quality, and ensures stable, cost-efficient production.